Grafana
Introduction
Grafana Open Source Software (OSS) enables you to query, visualize, alert on, and explore your metrics, logs, and traces wherever they’re stored. Grafana data source plugins enable you to query data sources including time series databases like Prometheus and CloudWatch, logging tools like Loki and Elasticsearch, NoSQL/SQL databases like Postgres, CI/CD tooling like GitHub, and many more. Grafana OSS provides you with tools to display that data on live dashboards with insightful graphs and visualizations.
Grafana Enterprise is a commercial edition of Grafana that includes exclusive data source plugins and additional features not found in the open source version. You also get 24x7x365 support and training from the core Grafana team. To learn more about these features, refer to Enterprise features.
How to Install
Starting via Binary
Quick Start
# option.1: Debian / Ubuntu repo
apt install -y apt-transport-https software-properties-common wget
wget -q -O /usr/share/keyrings/grafana.key https://apt.grafana.com/gpg.key
echo "deb [signed-by=/usr/share/keyrings/grafana.key] https://apt.grafana.com stable main" | tee -a /etc/apt/sources.list.d/grafana.list
apt update
apt install grafana

# option.2: resource
wget https://dl.grafana.com/oss/release/grafana-10.0.3.linux-amd64.tar.gz
tar -zxvf grafana-10.0.3.linux-amd64.tar.gz && rm -f grafana-10.0.3.linux-amd64.tar.gz
cd grafana-10.0.3
./bin/grafana server --config ./conf/defaults.ini
Config and Boot
Config
Main configuration file: /etc/grafana/grafana.ini
Server
[server]
protocol = http
http_addr = 0.0.0.0
http_port = 3000
domain = grafana.example.com
root_url = %(protocol)s://%(domain)s/
Database
# Default is SQLite3. For production, use MySQL or PostgreSQL.
[database]
type = postgres
host = 127.0.0.1:5432
name = grafana
user = grafana
password = grafana
ssl_mode = disable
SMTP & Alerting
[smtp]
enabled = true
host = smtp.example.com:587
user = [email protected]
password = secret
skip_verify = false
from_address = [email protected]
from_name = Grafana

[alerting]
enabled = true
execute_alerts = true
Image Rendering
[rendering]
server_url = http://grafana-image-renderer:8081/render
callback_url = http://grafana/
concurrent_render_request_limit = 10
Authentication
# OAuth2 with Keycloak / Generic OAuth
[auth.generic_oauth]
enabled = true
name = SSO
client_id = grafana
client_secret = secret
scopes = openid profile email
auth_url = https://auth.example.com/realms/main/protocol/openid-connect/auth
token_url = https://auth.example.com/realms/main/protocol/openid-connect/token
api_url = https://auth.example.com/realms/main/protocol/openid-connect/userinfo
role_attribute_path = contains(groups[*], 'admin') && 'Admin' || 'Viewer'
Provisioning
Grafana supports provisioning data sources and dashboards via YAML files placed in /etc/grafana/provisioning/.
# /etc/grafana/provisioning/datasources/prometheus.yaml
apiVersion: 1
datasources:
  - name: Prometheus
    type: prometheus
    access: proxy
    url: http://prometheus:9090
    isDefault: true
  - name: Loki
    type: loki
    access: proxy
url: http://loki:3100# /etc/grafana/provisioning/dashboards/default.yaml
apiVersion: 1
providers:
- name: default
orgId: 1
folder: ''
type: file
options:
path: /var/lib/grafana/dashboards
foldersFromFilesStructure: trueBoot(systemd)
# boot
systemctl daemon-reload
systemctl start grafana-server.service
systemctl enable grafana-server.service
Starting via Docker
pull images
# default based images: Alpine
# oss version(open source, default)
docker pull grafana/grafana
docker pull grafana/grafana-oss
# enterprise version
docker pull grafana/grafana-enterprise


# other based images: Ubuntu
# oss version(open source, default)
docker pull grafana/grafana:latest-ubuntu
docker pull grafana/grafana-oss:latest-ubuntu
# enterprise version
docker pull grafana/grafana-enterprise:latest-ubuntu
start container
# run
docker run -d -p 3000:3000 grafana/grafana-enterprise

# run with plugins
docker run -d -p 3000:3000 --name=grafana \
  -e "GF_INSTALL_PLUGINS=grafana-clock-panel 1.0.1" \
  grafana/grafana-oss:latest-ubuntu
docker run -d -p 3000:3000 --name=grafana --rm \
  -e "GF_INSTALL_PLUGINS=grafana-image-renderer" \
  grafana/grafana-enterprise:latest-ubuntu

# run with plugins by source
git clone https://github.com/grafana/grafana.git
cd grafana/packaging/docker/custom
docker build \
  --build-arg "GRAFANA_VERSION=latest" \
  --build-arg "GF_INSTALL_PLUGINS=grafana-clock-panel,grafana-simple-json-datasource" \
  -t grafana-custom .
docker run -d -p 3000:3000 --name=grafana grafana-custom
docker-compose = https://grafana.com/docs/grafana/latest/setup-grafana/start-restart-grafana/#docker-compose-example
Starting via Kubernetes
deploy on resource manifest
cat > grafana.yaml << "EOF"
kind: PersistentVolumeClaim
...
kind: Deployment
...
kind: Service
...
EOF
# https://grafana.com/docs/grafana/latest/setup-grafana/installation/kubernetes/

# send the manifest to API Server
kubectl -n monitoring apply -f grafana.yaml

# forward port on host
kubectl -n monitoring port-forward service/grafana 3000:3000
deploy on helm
# add and update repo
helm repo add grafana https://grafana.github.io/helm-charts
helm update

# get charts package
helm pull grafana/grafana --untar
cd grafana

# configure and run
vim values.yaml
persistence:
  enabled: true
  storageClassName: "xxx-nfs"
imageRenderer:
  enabled: true
...
helm -n monitoring install grafana .
Grafana Labs dashboards
Basic
# Node Exporter Full
1860
Kubernetes
# Kubernetes Dashboard
18283

# Kubernetes Cluster (Prometheus)
6417

# K8S Dashboard EN 20250125
15661
#
Database & Middleware
# Mysql
7362
# IOPS metrics
sum(irate(mysql_global_status_innodb_data_reads[5m])) by instance + sum(irate(mysql_global_status_innodb_data_writes[5m])) by instance

# Kafka
7589

# Redis
# single
11835
# cluster
763

# RocketMQ
10477
ObservabilityAnalysis
# loki logs
13186

# loki metrics
17781
Alert
telegram_bot
# 1.get bot and token
https://core.telegram.org/bots#how-do-i-create-a-bot
https://core.telegram.org/bots/features#botfather
# 2.create telegram alert group and invited bot into group
# 3.get bot or chat_id info
curl https://api.telegram.org/bot<token>/getMe
curl https://api.telegram.org/bot<token>/getUpdates
# 4.send test message
curl "https://api.telegram.org/bot<token>/sendMessage?chat_id=<chat_id>&text=<msg>"
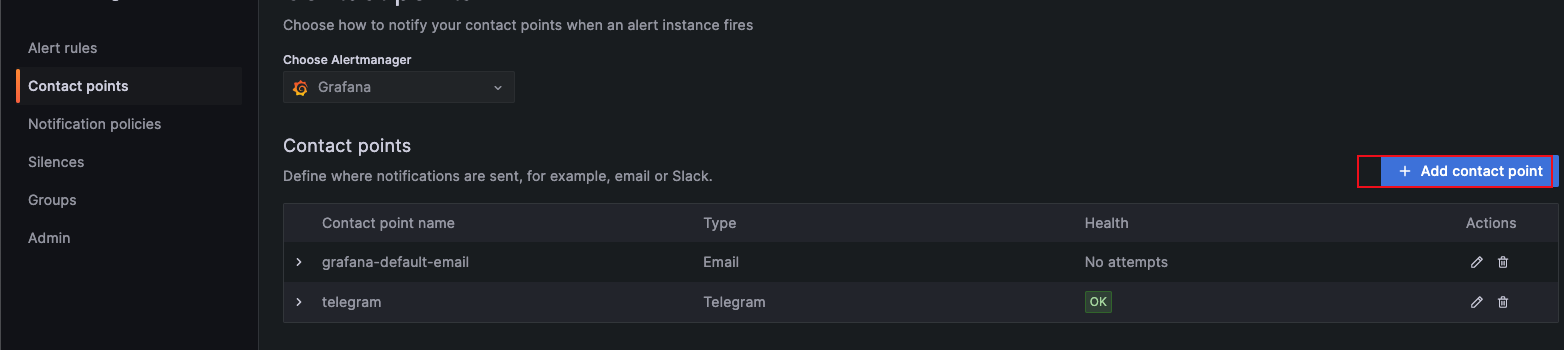
# 5.add bot to grafanaalerting config
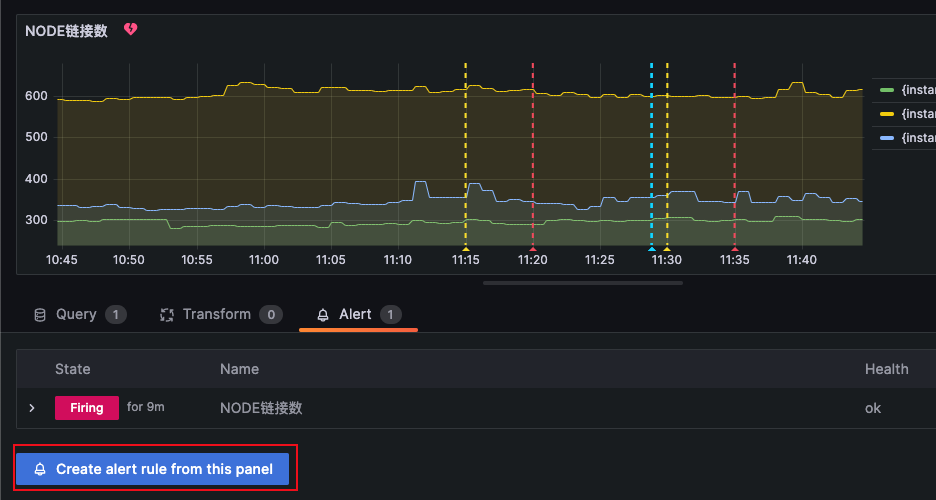
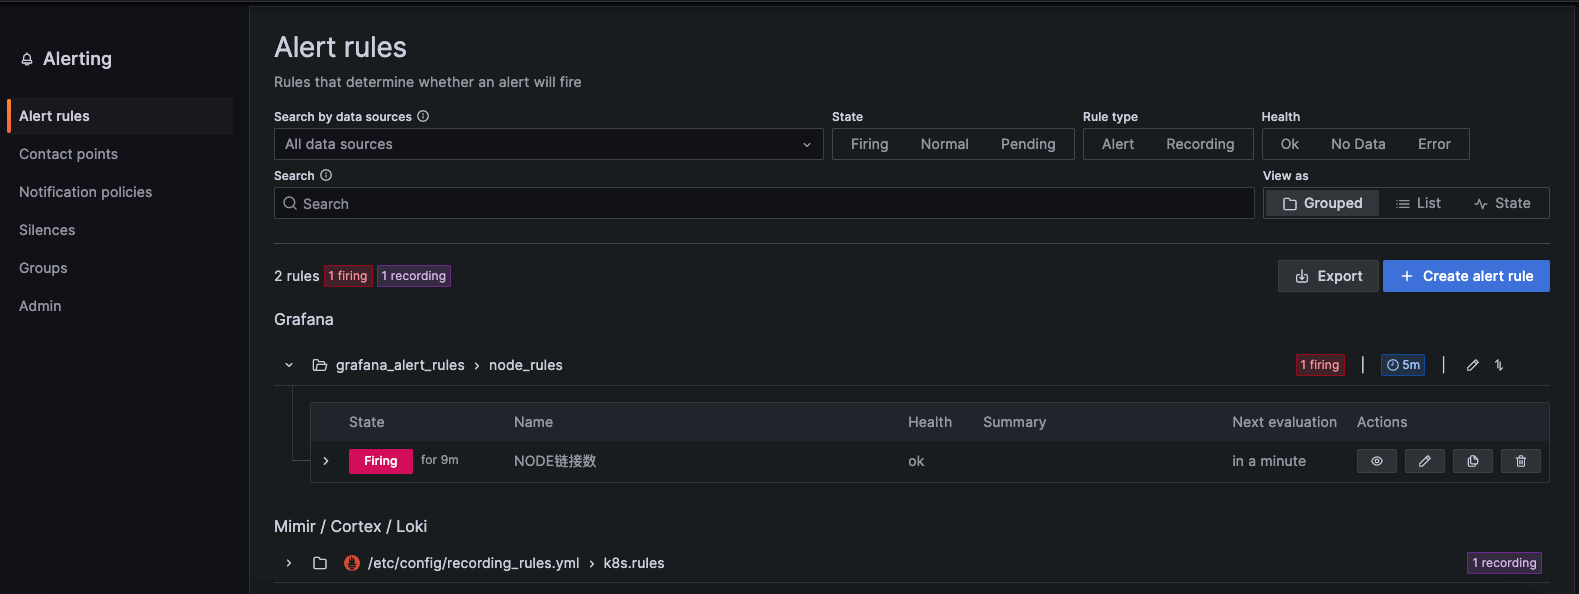
Dashboard --> edit panel --> create alert rule from this panel
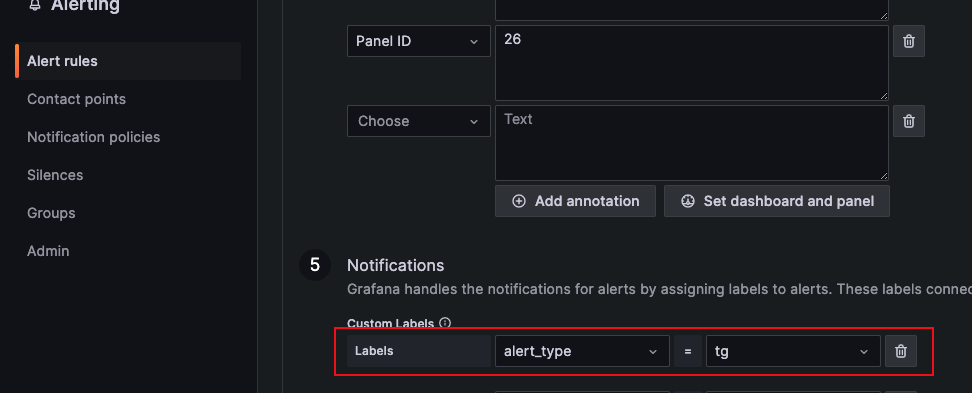
Notifications --> add Labels(related Contact points)
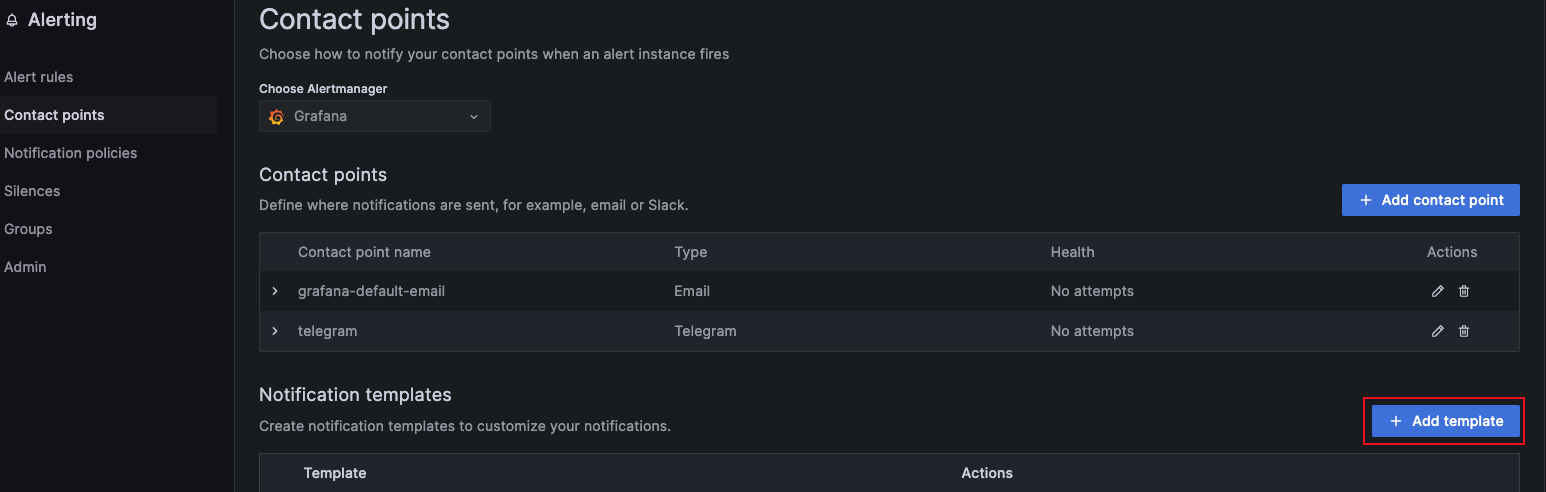
Contact points --> Add template --> create notification template
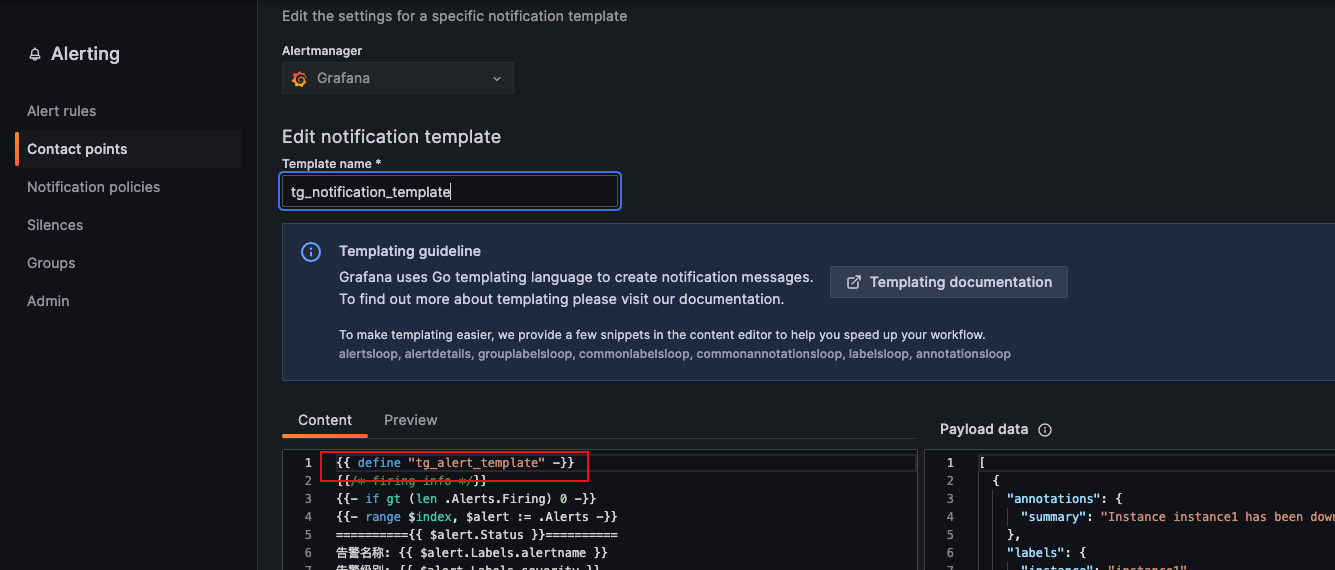
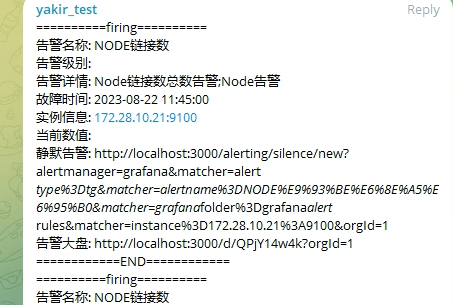
{{ define "tg_alert_template" -}} {{/* firing info */}} {{- if gt (len
.Alerts.Firing) 0 -}} {{ range $index, $alert := .Alerts }} =========={{
$alert.Status }}========== Alert Name: {{ $alert.Labels.alertname }} Severity: {{
$alert.Labels.severity }} Details: {{ $alert.Annotations.summary }};{{
$alert.Annotations.description }} Fired At: {{ ($alert.StartsAt.Add
28800e9).Format "2006-01-02 15:04:05" }} Instance: {{ $alert.Labels.instance }}
Current Value: {{ $alert.Values.B }} Silence Alert: {{ .SilenceURL }} Dashboard: {{
.DashboardURL }} ============END============ {{- end -}} {{- end }} {{/*
resolved info */}} {{- if gt (len .Alerts.Resolved) 0 -}} {{ range $index,
$alert := .Alerts }} =========={{ $alert.Status }}========== Alert Name: {{
$alert.Labels.alertname }} Severity: {{ $alert.Labels.severity }} Details: {{
$alert.Annotations.summary }};{{ $alert.Annotations.description }} Fired At: {{
($alert.StartsAt.Add 28800e9).Format "2006-01-02 15:04:05" }} Resolved At: {{
($alert.EndsAt.Add 28800e9).Format "2006-01-02 15:04:05" }} Instance: {{
$alert.Labels.instance }} Current Value: {{ $alert.Values.B }} Silence Alert: {{
.SilenceURL }} Dashboard: {{ .DashboardURL }} ============END============ {{- end
-}} {{- end }} {{- end -}}- Contact points --> Add contact point --> create telegram contact point
# Message {{ template "tg_alert_template" . }}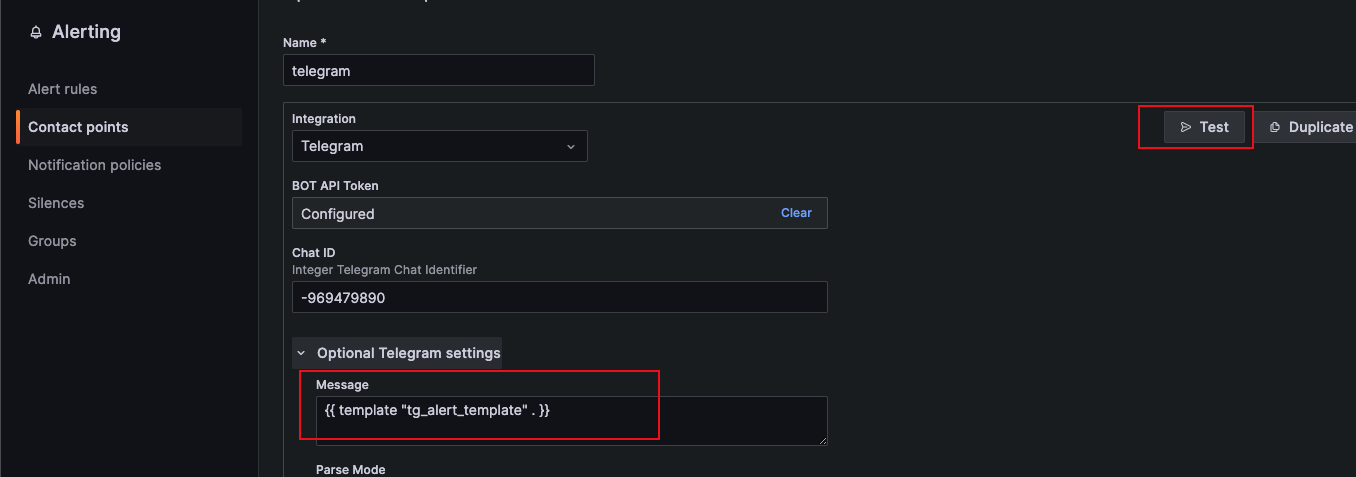
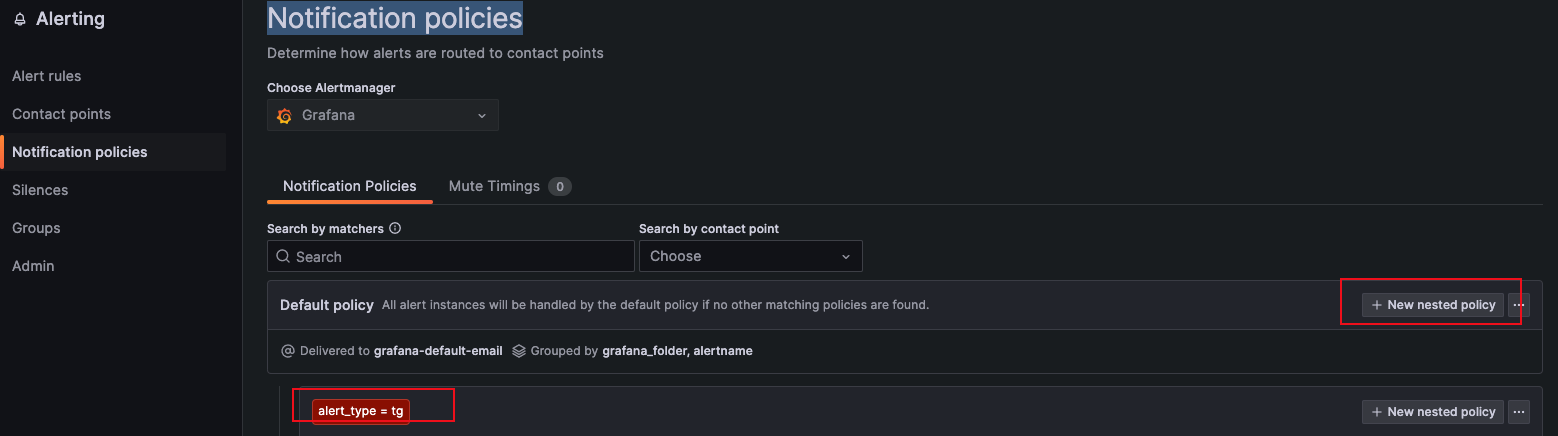
Notification policies --> New nested policy --> create new notification policy
Check alert notification
Reference: